
Have you ever wondered how to make your development projects run smoothly especially when it comes down to figuring out why features are throwing errors or not functioning to specifications? In this post, I will show you how 729Solutions used the tools at New Relic to circumvent these pain points for a complex mobile application project that we recently completed.
Beyond Application Performance Monitoring
With tight deadlines and limited budgets, development teams need every edge to find out why features aren’t functioning as required. When human tests are failing, it’s important that the exact cause is identified so a fix can be implemented quickly.
We recently built an equipment financing mobile application for iOS and Android where New Relic tools played a critical role. It was a relatively complex project requiring several API integrations with third-party services. To add to these challenges, three development teams worked on the project. The 729 team was responsible for building the applications while the other two teams built the middle “layer” that was mainly responsible for handing data off between the client’s CRM and the applications.
When I look back at this project, I see it as a prime example of why 729Solutions encourages our clients to implement New Relic – even during the development phase. Put simply, it allows teams to be proactive rather than reactive.
What is New Relic?
At its core, New Relic provides analytics software products for infrastructure and application performance monitoring. They provide a suite of tools that capture information allowing you to:
- View and manage application performance.
- Identify and troubleshoot bottlenecks.
- Analyze data about customer usage and experience.
- Get notified about problems before customers experience them.
- Monitor your technical resources and environments.
For our equipment financing mobile app, we went beyond performance monitoring and used New Relic’s tools to help speed up the development process.
The Right Tools for the Job
With three development teams working on the project, it was imperative to quickly identify who was responsible for applying fixes whenever errors or other issues were encountered. Further, since there were several third-party integrations, it was crucial for us to be able to identify precisely where the breakdown was happening.
For this project, we set up New Relic Mobile and New Relic Insights. It’s worth noting that the middle layer portion of the project was built on a Salesforce instance in the cloud, so New Relic Infrastructure was not utilized.
With New Relic Mobile, we were able to monitor key performance data on both the iOS and Android versions of the application during development. This proved invaluable especially during user acceptance testing when latency was experienced and crashes occurred. When an incident cropped up, we could go into the New Relic admin panel to view events that led up to the crash. We could even provide the dev teams with a detailed stack trace to help resolve issues quickly.
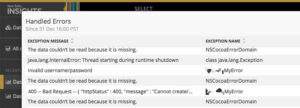
New Relic Insights was also used which allowed the 729 Solutions dev team to set up custom dashboards for each version of the application. These dashboards consisted of “widgets” that displayed customized data points on user interactions and exception errors.
Prior to this project, the client was not familiar with New Relic. Thankfully, they were open to using tools that would aid in development.
The Proof is in the Pudding
The value of implementing New Relic during development happened during a daily standup call with the client and the development teams. During the call, the client tested a feature and an error was thrown. Since the 729 Solutions team was responsible for building the front-end, it was logical for the client to conclude that the error was caused by the application and that we were responsible for applying a fix.
While on the call, I immediately logged into New Relic and was able to view his interactions with the application. Two data points we were capturing in Insights were the “Endpoint URL” and the “Server Response”. By looking at this information, I could see exactly which endpoint URL was actually throwing the error, and I was able to show the client the data that the server was returning.

At the risk of sounding like a complete nerd, it was a thrill for me to show the client exactly where the problem was happening. As it turned out, the issue was getting triggered in the middle layer portion. Their development team was also on the call, and they were able to apply a fix on the fly. We were able to validate that the issue was resolved all during the same standup call!
Without New Relic, none of this would have happened. The client would have made an incorrect assumption, and the 729Solutions team could have burned time tracking down the actual cause of the error.
Smooth Sailing
After this experience, the client, as well as the development teams, continued to rely heavily on New Relic, especially during testing phases. We were able to identify issues with pinpoint accuracy, and we could communicate with the appropriate development team to apply fixes. As a project manager, this comes as a welcome relief for complex and large scale projects.
Do you need help with your New Relic instance?
729 Solutions can review or implement New Relic to help your development run smoothly and efficiently!